Identity inputs
The table stores contact details, practice area, city, and firm size.
Workflow design · Internal prototype
Airtable + Zapier
I was trying to answer a practical question: could one intake score a law firm lead, shape a useful report, and point the follow-up in the right direction? This case study pairs live Airtable evidence with recreated reference visuals for the intake, automation, and report flow.
28 fieldsin the live Airtable table
5 score partscombined into Total Score
3 lead tiersHot, Warm, and Nurture
Softr linksgenerated per Airtable record
A law firm would answer questions about its practice, marketing spend, case value, team size, and current channels. Those answers would feed a score, shape a Market Intel Report, and help decide what should happen next.
The hard part was figuring out where automation was actually useful. Some steps fit the tools. Others needed a workaround or a person in the loop.
The live Airtable view is the piece I can still open and inspect. It has 14 rows and 28 fields. The screenshots below are real, with names, contact details, firm identities, and record-level report links cropped out.
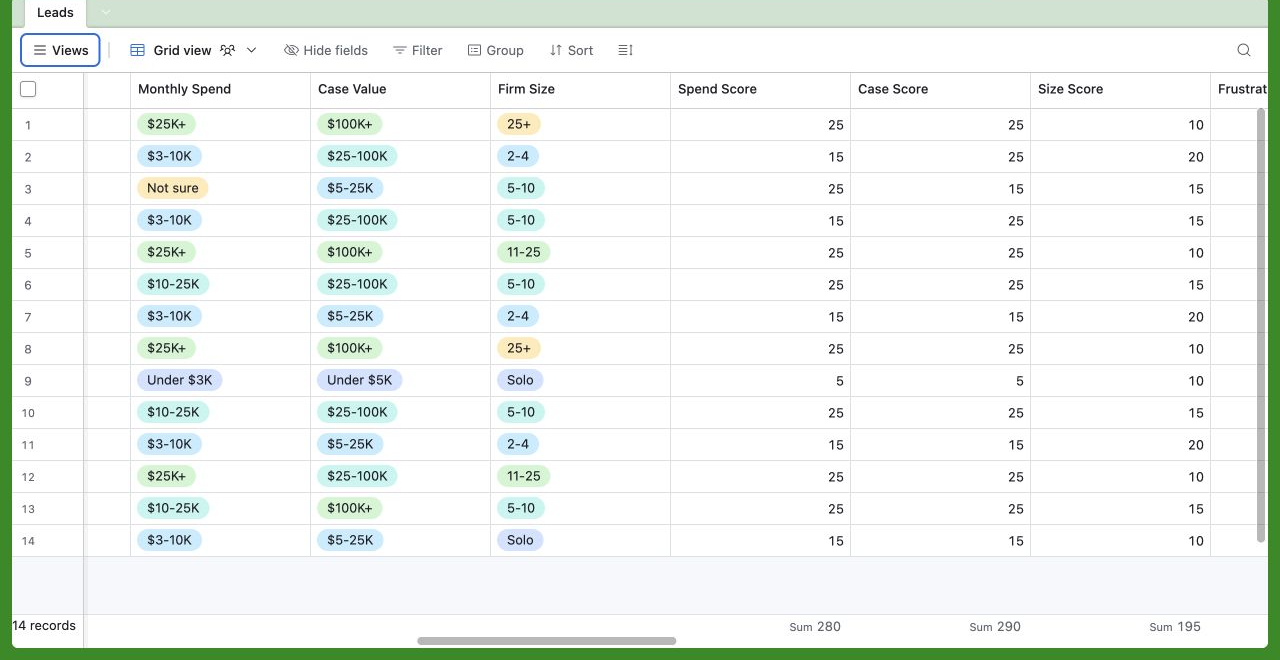
The table stores contact details, practice area, city, and firm size.
Monthly Spend and Case Value are single-select fields shown beside the score outputs.
It also records marketing frustration, current channels, YouTube status, and video concerns.
Five component scores feed a total and tier. The base also creates a report link for each record.
The live table shows separate scores for Spend, Case, Size, Frustration, and YouTube. In every row I could inspect, those five numbers add up to the displayed Total Score.
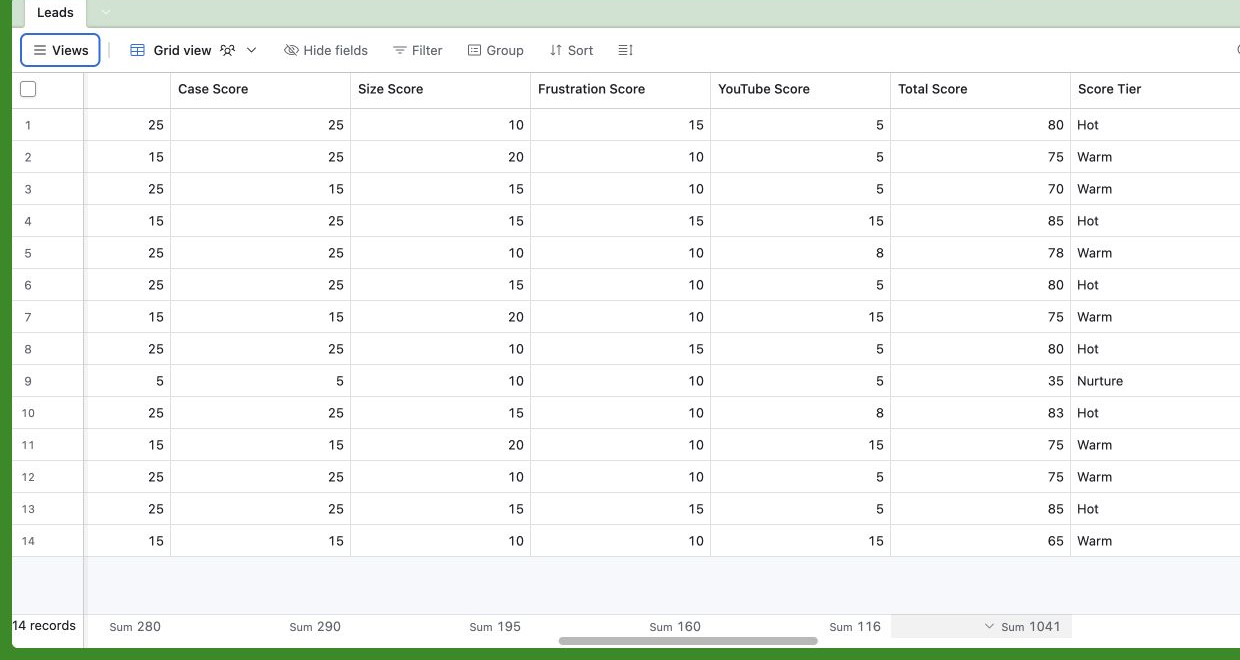
The visible rows suggest Hot starts at 80, Warm includes at least 65 through 78, and a score of 35 lands in Nurture. The rows do not reveal every cutoff, so this case study shows only the values present in the live view.
This reference visual maps representative questions to fields in the live Airtable base. It is a reconstruction from project records, not an original Typeform screenshot.
What is your primary practice area?
Practice AreaWhich city or metro do you serve?
CityWhat is your monthly marketing spend?
Monthly SpendWhat is a typical case worth?
Case ValueHow large is the firm?
Firm SizeWhat is your current YouTube status?
YouTube StatusWhere should the report be sent?
Contact fieldsThe Typeform intake gathered the firm, marketing, spend, case value, and channel inputs used downstream.
Live evidence. The fields, component scores, totals, tiers, and report-link formulas are visible in Airtable.
The Zapier layer represents the handoffs between intake, scoring, reporting, and follow-up.
Airtable creates a different Softr URL for each record. I did not test what those links open.
The mapped journey moves from submission into a thank-you page and booking path.
The proposed high-value branch sends the team a lead alert for faster review.
The follow-up branch uses the score, tier, summary, and next-action fields to guide outreach.
Each page is built from the project’s documented fields, flow, and report outline. Sample Firm and its contact details are fictional.
Ten mapped prompts with a working progress flow.
Open page → 02 / ReportA full sample report with score, gaps, ROI frame, and 90-day plan.
Open page → 03 / ConversionThe post-submission page with report status and sample times.
Open page → 04 / DeliveryA personal delivery note that points to the report and review call.
Open page → 05 / WorkflowA custom view of the trigger, Airtable logic, and follow-up branches.
Open page →The brief called for the five sections shown here. This is the planned outline, not a finished client report.
Recreated from project recordsProject records show that Canva Bulk Create could personalize the report, but someone still had to trigger the generation step. That fell short of the original goal: a report created and sent as soon as the intake arrived. This visual recreates the decision point and the fallback that followed.
One submission creates the record, calculates the score, and starts the report and follow-up.
Bulk personalization still needed a person to generate the report.
Keep the scoring in Airtable, test other report tools, and leave room for a final human review.
| Component | Evidence status | What can be said |
|---|---|---|
| Airtable data model | Verified live | Twenty-eight intake, formula, summary, and next-action fields exist. |
| Scoring and tiers | Verified live | Five component scores sum to Total Score in observed rows; Hot, Warm, and Nurture appear. |
| Softr report link | Verified field | A formula creates a Softr URL per record. The recreated report shows the intended page experience. |
| Typeform intake | Reconstructed | The intake and its Airtable field mapping are shown as a reference visual based on project records. |
| Zapier flows | Reconstructed | The report and follow-up handoffs are shown as a labeled reference flow. |
| Report modules | Intended | The outline documents the plan. It does not prove a report was completed or delivered. |
| Launch and results | Do not claim | The prototype never launched, so there are no client deliveries or business results to claim. |
The live Airtable evidence supports the data model and scoring layer. The recreated visuals show the surrounding work without presenting them as original product screenshots.
I designed the intake structure, Airtable data model, scoring logic, and Zapier handoffs for the report and follow-up paths.
I also worked on the thank-you page, booking path, and report experience.
I compared report-delivery options and ran into the limits of bulk personalization.
When full automation was not practical, I recommended keeping the data and presentation layers separate.
I am not claiming a production launch, client delivery, business results, or a confirmed final report platform.
I took a fuzzy funnel idea and made it concrete enough to test. The Airtable layer worked as a model for intake and scoring. Report generation exposed the real constraint, and the project stopped before launch. That is the honest version of the work.